Setting up your tracking in 2026: goals, reference period and useful indicators
Define a reliable reference consumption (before works) free of weather or usage bias
For useful tracking, start from a 12-month reference, ideally with two full winters if you have them. Neutralize the weather effect by correcting the heating share with the HDD (heating degree days) from the nearest station. Also note the usage changes that skew everything: number of occupants, remote work, setpoint temperature, extension of the heated surface. Keep the invoices and monthly readings.
Choose your performance indicators: kWh, euros, kWh/m².yr and perceived comfort
Keep few indicators, but the right ones. kWh measure the energy reality. Euros speak to the client, but they vary with tariffs. kWh/m².yr helps compare dwellings, at a constant heated surface area. Add feedback from the field, comfort in winter and summer, humidity, rooms that are hard to heat, with a simple 1-to-5 rating.
Set a review calendar: 1 month, 3 months, 1 heating season, 12 months
At 1 month, you validate the settings and detect any drift. At 3 months, you compare against the weather-corrected reference. Over a heating season, you check comfort stability. At 12 months, you finalize the annual report, energy, cost, gaps, and adjust the settings and maintenance.
Setting up simple monitoring: data, tools and field best practices
Record consumption by use: heating, DHW, ventilation, auxiliaries
For tracking by use, start from the incoming energy (electricity, gas, wood) then break it down. Heating and DHW are often read via the controller, an energy meter or dedicated readings. Ventilation and auxiliaries (circulator pumps, backup heaters, ventilation units) are tracked with a small electrical sub-meter or a smart plug. The goal is simple: spot drift and confirm the gains after works.
Secure data quality: meter readings, invoices, sub-meters, gateways
Base your work on reliable data. Readings taken on fixed dates, meter photos, monthly invoices, and sub-metering on key items where possible. A remote-reading gateway or the supplier's export helps automate things, but keep an on-site verification. A missing or shifted data point quickly skews the analysis. Readings become more reliable when actual consumption is pulled from the energy distributors with the client's consent.
Factor in weather and habits: HDD, occupancy, setpoints, schedules
Compare consumption against HDD and the occupancy calendar. Note the setpoints, time slots, absences, and changes in usage (remote work, baths, increased ventilation). The same dwelling can vary significantly with no technical fault involved. Normalizing by weather keeps you from judging a project on one cold week.
Interpreting consumption gaps: understanding, correcting, improving performance
Distinguish usage drift from a setting fault: thermostat, weather compensation, balancing
A gap can come from a change in usage. Remote work, extra rooms heated, a raised setpoint. Before blaming the equipment, look at the tracking of temperatures and schedules. On the settings side, check the thermostat programming, the weather compensation curve (flow temperature based on outdoor weather) and emitter balancing. A poorly balanced network overheats near the generator and underheats at the far end.
Spot warning signs: overconsumption, short cycles, discomfort, humidity
Sudden overconsumption, short cycles on a heat pump or boiler, circulation noise, temperature swings. Add localized discomfort and humidity (condensation, mould), often linked to insufficient ventilation or a setpoint that's too low in certain rooms. These signals indicate that kilowatt-hours are being wasted.
Prioritize corrective actions: settings, small works, occupant support
Start with the settings. Adjust the setpoint, time slots, flow rate, balancing. Next, quick small works. Pipe insulation, bleeding, sealing of hatches, adjustment of ventilation vents. Finish with occupant support. Explaining two or three simple habits stabilizes performance and avoids chasing after gaps.
Proving the gains and showcasing your projects: measured performance, financial aid and client relationships
Build a clear report for the client: before/after, savings, comfort, CO₂ avoided
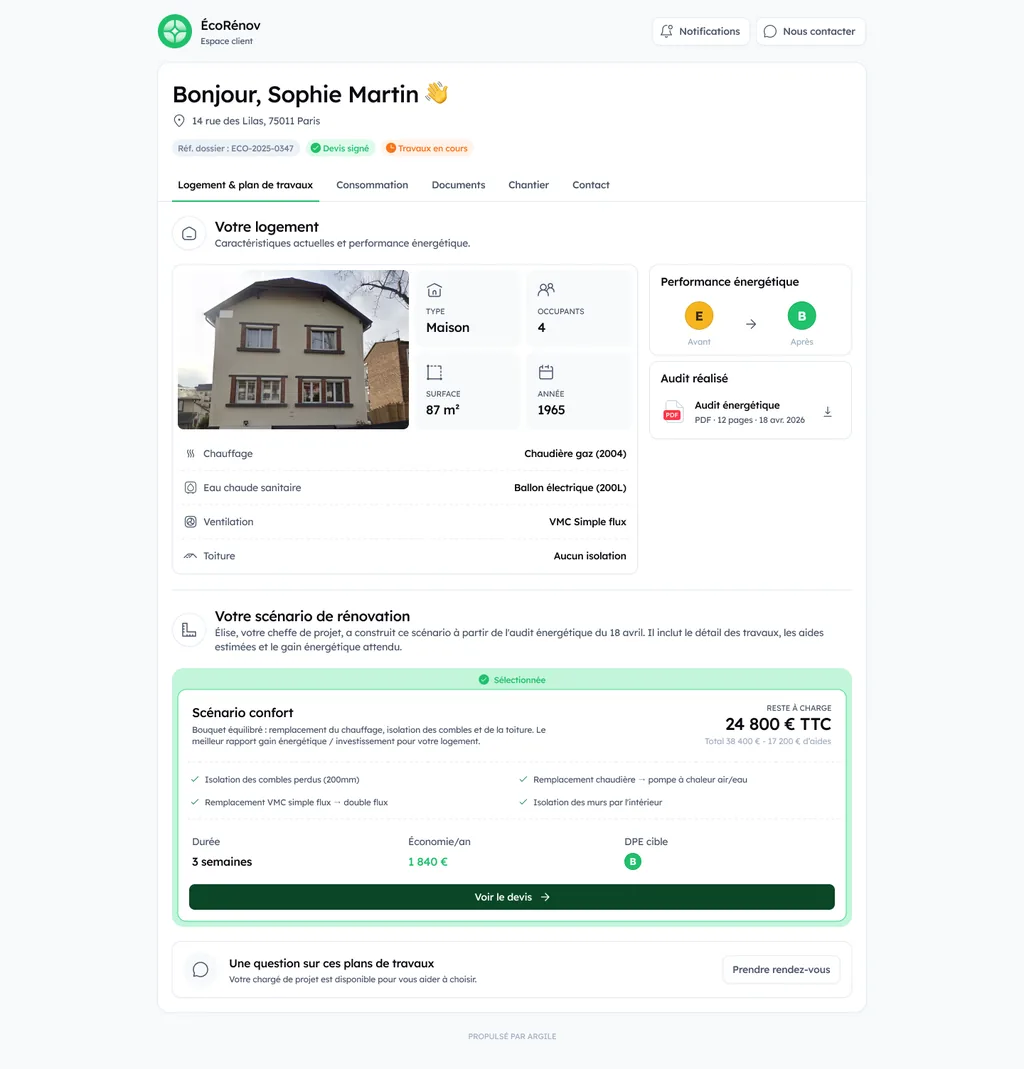
After the works, put the results in the spotlight with a clear report. Take the starting data, then compare. DPE, consumption readings, photos and comfort points (more stable temperature, fewer drafts). Add an estimate of the kWh saved and the CO₂ avoided. This simple tracking reassures the client and gives concrete value to the project. This report can be shared without attachments when the client follows their consumption and the savings from the new system in their own portal.
Align tracking with requirements: consistency with the energy audit, scenarios and supporting documents
To secure MaPrimeRénov' and CEE in 2026, keep the same thread running between the energy audit, the chosen scenarios and the execution. Keep quotes, technical sheets, proof of performance, and installation supporting documents. A consistent file limits back-and-forth and speeds up the payment of aid.
Build loyalty through follow-up: check-in visits, seasonal adjustments, recommendations
The project doesn't end at handover. Offer follow-up with a check-in visit, then a summer and winter check-in for the settings (heat pump, ventilation, thermostatic valves). Use the opportunity to recommend good usage habits and, if needed, a next insulation step. To go further, rely on post-works follow-up.
Integrating Argile into your tracking: from diagnosis to quote, then post-works management
Link the quick diagnosis and renovation scenarios to observed consumption
In Argile, you start from a quick energy diagnosis to frame the dwelling, then you connect these assumptions to actual consumption. Invoices, readings, usage. Everything helps keep reliable tracking and simply explain why a given scenario (insulation, ventilation, heating) is a priority.
Generate quotes and simulate financial aid (MaPrimeRénov', CEE) while staying consistent with performance
You build your work items from the scenarios, then Argile generates a quote consistent with the performance target. The MaPrimeRénov' and CEE simulation helps you announce a credible remaining cost, without promising more than the rules and supporting documents allow. A readable quote that holds up.
Save time on the technical visit and admin work to spend more time on tracking
Argile structures the technical visit and centralizes the documents. Photos, measurements, points of attention. Then, the admin work is guided to limit back-and-forth and secure applications. The result: you free up time for job tracking and post-works management.