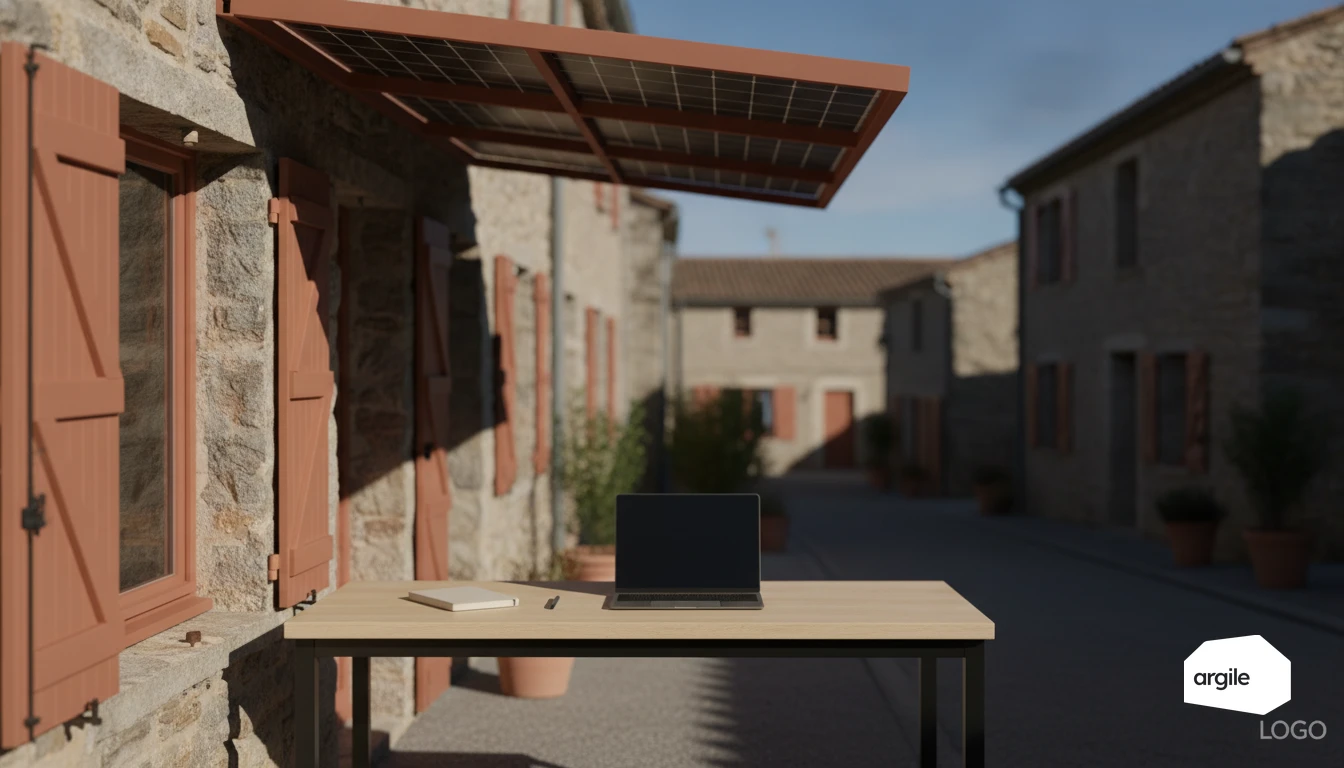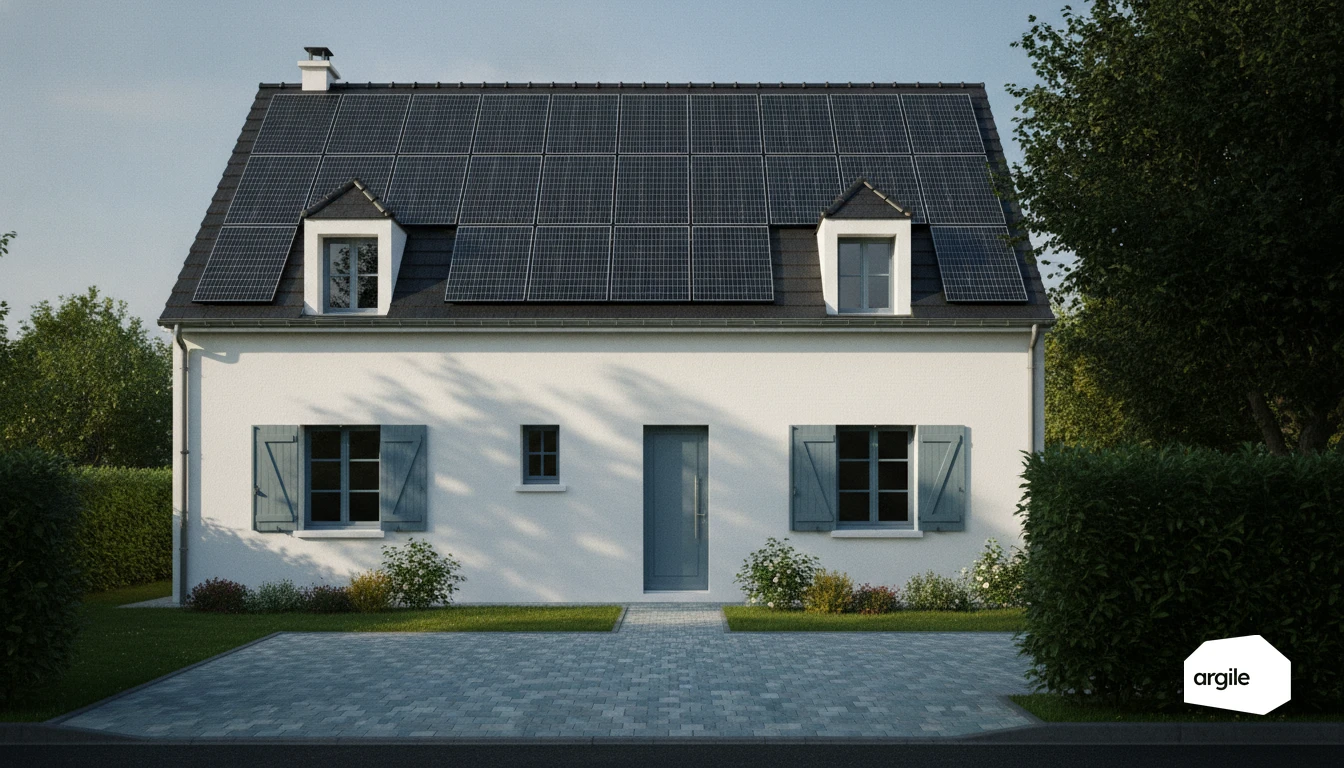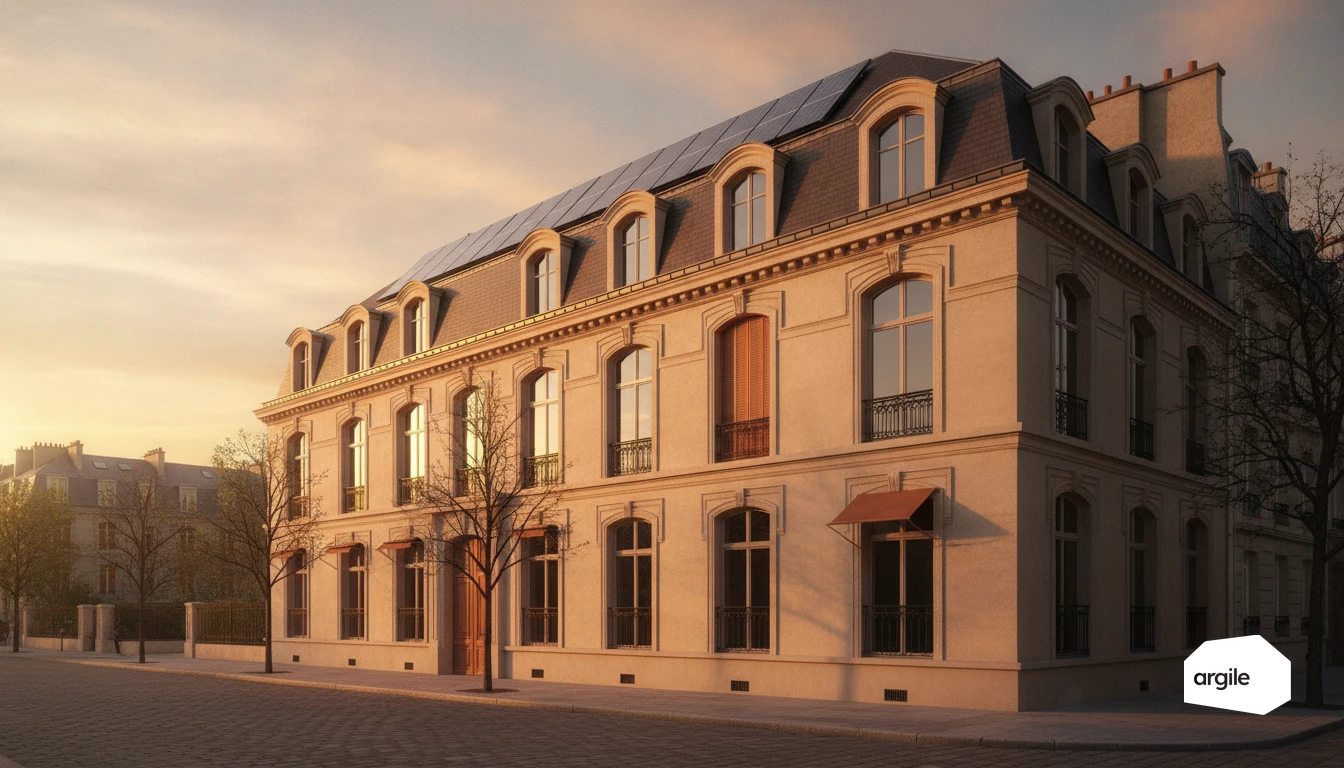
The azimuth of a photovoltaic array is counted from true south, and the orientation coefficient relates the yield expected in the actual configuration to that of a reference plane. A due south roof pitched at 30° is worth 1.00 in the reference tables, where a north orientation falls to between 0.55 and 0.65, east and west sitting between the two. Three mistakes come back on the visit: reading magnetic south on a phone instead of true south, confusing roof pitch with the actual tilt where the array is mounted on frames, and overlooking a nearby obstruction whose effect often exceeds that of 10° of azimuth. The orientation coefficient serves to frame the yield carried into the quote, with a range and a safety margin, never a single figure promised to the client.
Understanding how orientation affects photovoltaic output
Why azimuth and tilt change your annual kWh
On a photovoltaic job, two settings affect the sun harvest. Azimuth is the direction the array of modules faces relative to south. Tilt is the angle of the panels relative to horizontal. In mainland France, an orientation close to south and a slope around 30 to 35° generally maximize annual output, because they follow the sun's path more closely. The further you move toward east or west, the more annual kWh drop, even though the curve can become more spread out over the day.
Orientation coefficient: what it concretely means on a job site
The orientation coefficient is a simple ratio between the expected output in your actual configuration and that of an "ideal" plane. You find it in simulations and yield studies. This is the figure that prevents overpromising, and that protects sizing, profitability and the client pitch.
Common mistakes: confusing geographic south, shading, roof slope
Three pitfalls come up often. South measured with a phone can be magnetic, not geographic. Light shading (tree, chimney, dormer) can weigh more heavily than a 10° azimuth deviation. Finally, the roof slope is not always the final tilt if you mount on a frame or on top of the roof covering.
PV orientation coefficient tables: how to read and apply them correctly
Reading a table: locating orientation (east/south/west) and tilt (°)
A table gives a production coefficient for a photovoltaic array along two axes. Orientation (east, south, west) corresponds to azimuth. Tilt is the angle relative to horizontal. Start by checking the convention used. Some tables express azimuth relative to south, others relative to north. Then cross the row (tilt) and the column (orientation) to take the value closest to your roof. To go further on the orientation/slope pairing and its impact, see our article on PV panel orientation and tilt.
Simple interpolation between two values: staying consistent in the calculation
If your slope falls between two rows, interpolate linearly. Example: between 20° and 30°, take a third of the gap if you are at 23°. Keep the same orientation reference and the same unit throughout. The goal is to avoid a mix of conventions that would skew the estimated yield.
When the table is not enough: nearby obstructions, obstacles and micro-shading
The coefficients assume an "average" sky and a clear surface. As soon as there is a chimney, parapet, tree or distant obstruction, the loss is no longer proportional. In that case, switch to a simulation tool with shading or an on-site survey. You protect the actual sizing and the client promise.
- Nearby obstruction. Strong impact, especially morning and evening.
- Micro-shading. Possible chain effects depending on the wiring and inverter.
2026 calculation method: estimating output and protecting your photovoltaic quotes
Data to collect on site visits: usable surface, slope, orientation, environment
On site, record the usable surface that can actually be fitted (excluding edges, walkways, obstacles). Note slope and orientation (azimuth), roof covering type, and inverter location. Photograph nearby and distant obstructions (trees, parapets, chimneys), since shading quickly reduces photovoltaic yield. Add the precise address for local weather data and check the condition of the electrical panel.
Step-by-step calculation: from yield to self-consumed energy (and the surplus)
1) Estimate the installable power (kWp) from the module layout. 2) Retrieve the yield (kWh/kWp/year) using a reference tool such as PVGIS. 3) Apply realistic losses (temperature, cabling, inverter). You get the expected annual energy. 4) Cross-reference with the household's consumption (occupancy hours, DHW, EV) to approach the self-consumption rate. The rest goes to surplus.
Turning the calculation into a quote: clear assumptions and safety margins
In the quote, write down your assumptions (yield source, orientation, losses, consumption profile). Show a range rather than a single figure. Keep a safety margin (for example, -5% on production) and spell out what could change (seasonal shading, changes in usage). Your client understands, and you protect your commitments.
Practical cases for installers: choosing the right scenario by orientation
East-west roof: balancing output and self-consumption
On an east-west roof, it is often better to propose two arrays of modules rather than one. Photovoltaic output is more spread out in the morning and late afternoon, with a smoothed peak. This is useful if the household consumes during the day (remote work, DHW, mechanical ventilation), even though the annual total may be lower than with full south exposure.
South roof with low slope: optimizing power without overpromising
With a low slope, energy output remains good, but the issue is overheating, soiling and wind loading. Frame the pitch around actual power, not records. Check shading and ventilation, and size according to the consumption profile and the export limit.
Unfavorable orientation: alternatives (power, placement, whole-house renovation)
If the orientation is unfavorable or shading is heavy, secure the project. Reduce the power, move the modules to a better-exposed section, or study installation on an outbuilding. Micro-inverters or optimizers help, but are no miracle fix. Otherwise, prioritize a whole-house renovation (insulation, airtightness, heat pump) to lower the bill before returning to solar.
How Argile speeds up your calculations and strengthens your photovoltaic proposals
Quick energy diagnosis: building in orientation and coefficient logic from the study stage
Argile helps you frame a first photovoltaic proposal without starting from scratch. From the study stage, you factor in orientation, tilt and a consistent production coefficient. The result: a clear time saving, and a more defensible order of magnitude. Module layout on the roof, expected output for the azimuth and tilt, self-consumption and export are all simulated inside the same photovoltaic workflow.
Feasibility analysis: spotting constraints at the address and prioritizing work
At the address, Argile highlights the constraints that often derail a photovoltaic project. Shading, roof access, planning rules, protected zones, grid connection. You quickly see the key constraints and prioritize actions before pricing.
Quotes and subsidies: faster pricing, traceable assumptions, simplified paperwork
Argile turns your assumptions into a readable quote. Targeted power, estimated output, self-consumed share, surplus, and the related calculation elements. As subsidies and rates change, you keep traceable assumptions and prepare more confidently for documents like the prior planning declaration, the Consuel certificate and the grid connection request.